Boston Consulting Group – BCG – Matrix
Introduction
BCG matrix was developed in 1970s by The Boston Consulting Group, a global management consulting organization. Also known as BCG growth-share matrix, it is used for managing a portfolio of different business units in an organization.
It shows a relationship between the market growth rate and relative market share of a business unit. The market growth rate helps in judging whether an organization should remain in the particular industry or not. High market share gives special benefits to the organization, such as strong bargaining power.
BCG Figure
It divides the business units into four categories to allocate the resources of a business, as shown in Figure below
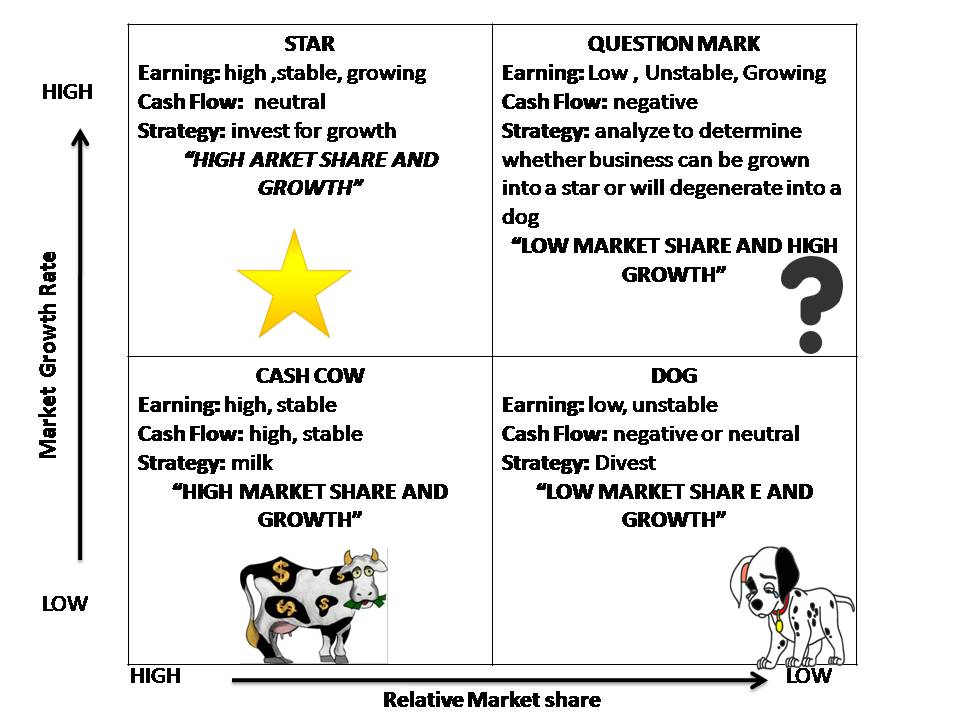
BCG matrix represents the market growth of business units and their relative market share. The discussion of the BCG matrix is as follows:
-
Cash Cows:
- Refer to the business units that hold a large market share and strong business position in the market. However, the industry in which these business units operate is a slow-growth industry.
- These business units are in the maturity stage of their life cycle and require less investment.
- The returns in these business units are often more than the investment done.
- The products of a cash cow business unit provide complete satisfaction to the customer and develop generic names. For example, Bisleri for water and Xerox for photocopying.
-
Stars:
- Refer to business units that grasp a large market share in a growing market. Star business units are in their emerging stage with high investment needs to promote products.
- When the industry matures, a star becomes a cash cow and hardly needs any investment.
-
Question Marks:
- Refer to the business units that have low market share in high growth market. These types of business units require high investment because their cash needs are high.
- As the market is growing rapidly, it is easier for such business units to acquire market share. However, if a dominant player already exists in this-industry, it is better for an organization not to invest in question mark units.
- On the other hand, if there are numerous competitors with no dominant share, it would be fruitful to invest in question mark units.
-
Dogs
- Refer to business units with low market share and limited growth.
- These business units do not need much investment and give limited returns. Thus, they have limited scope of growth. It is advisable for such business units to liquidate or divest.
- However, sometimes organizations keep the dog business units in their portfolio to complete the product range.
- According to various researches, such well-managed business units can have a positive effect on an organization.
- The characteristics of these business units are narrow business focus, concentration on high quality products, and control of costs through less advertising.
- These business units can generate good surplus; however, the possibility of turning into cash cows does not exist.
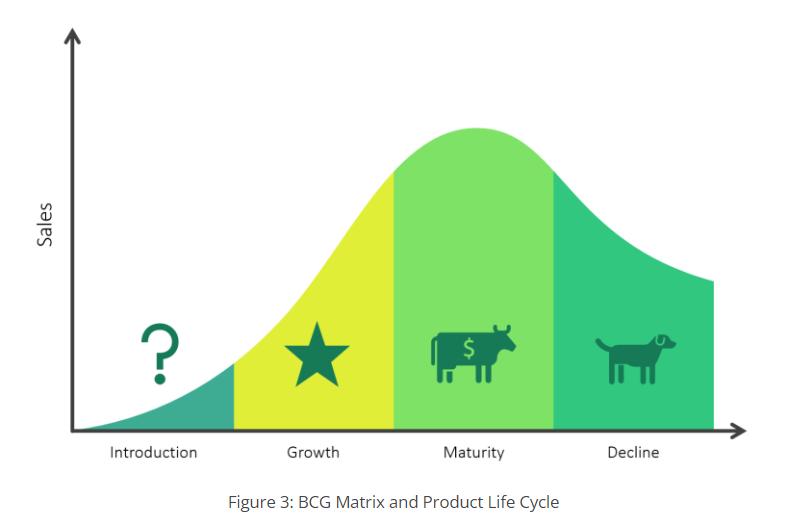
BCG Matrix and the Product Life Cycle
The BCG matrix has a strong connection with the Product Life Cycle. The Question Marks represent products or SBU’s that are in the introduction phase. This is when new products are being launched in the market. Stars are SBU’s or products in their growth phase. This is when sales are increasing at their fastest rate. Cash Cows are in the maturity phase: when sales are near their highest, but the rate of growth is slowing down due to saturation in the market. And Dogs are in the decline phase: the final stage of the cycle, when sales begin to fall.